In the past, our analytical lab would take bi-weekly or monthly customer dip tank samples and run internal quality checks to confirm that the tank was still “healthy”. Tests such as viscosity, pH, wt./gallon, % wt. solids, gloss, adhesion, and cure were the “go-to’s” to confirm that everything was performing as expected. This process always worked to help indicate what adds needed to be made or “predict” potential problems.
Tank Test examples:

By examining the graphs, it is easy to determine certain characteristics and trends for this specific dip tank. For example, if the solids were too high and the viscosity was high, we would feel comfortable in making an addition to lower the viscosity. The tricky part is determining what add to make. Is it simply water – or solvent – or some combination?
Obviously, solvents, water and amines were evaporating out of the tank. Paint adds were being made. Over time, depending on how much paint was being used, the overall volatile percentages could be significantly different from what was formulated into the coating. These combinations of solvents, amines, and other volatile materials not only contribute to the flow, leveling, cure, and appearance of the coating – they also contribute to dip tank stability.
What if there is a problem? The last thing you want to do is to make multiple adds to a tank – hoping and guessing what it needs. This is costly and could potentially lead to more complex problems.. One of the best ways to ensure that the volatile ratios are kept where they need to be is to analyze the tank samples using a GC.
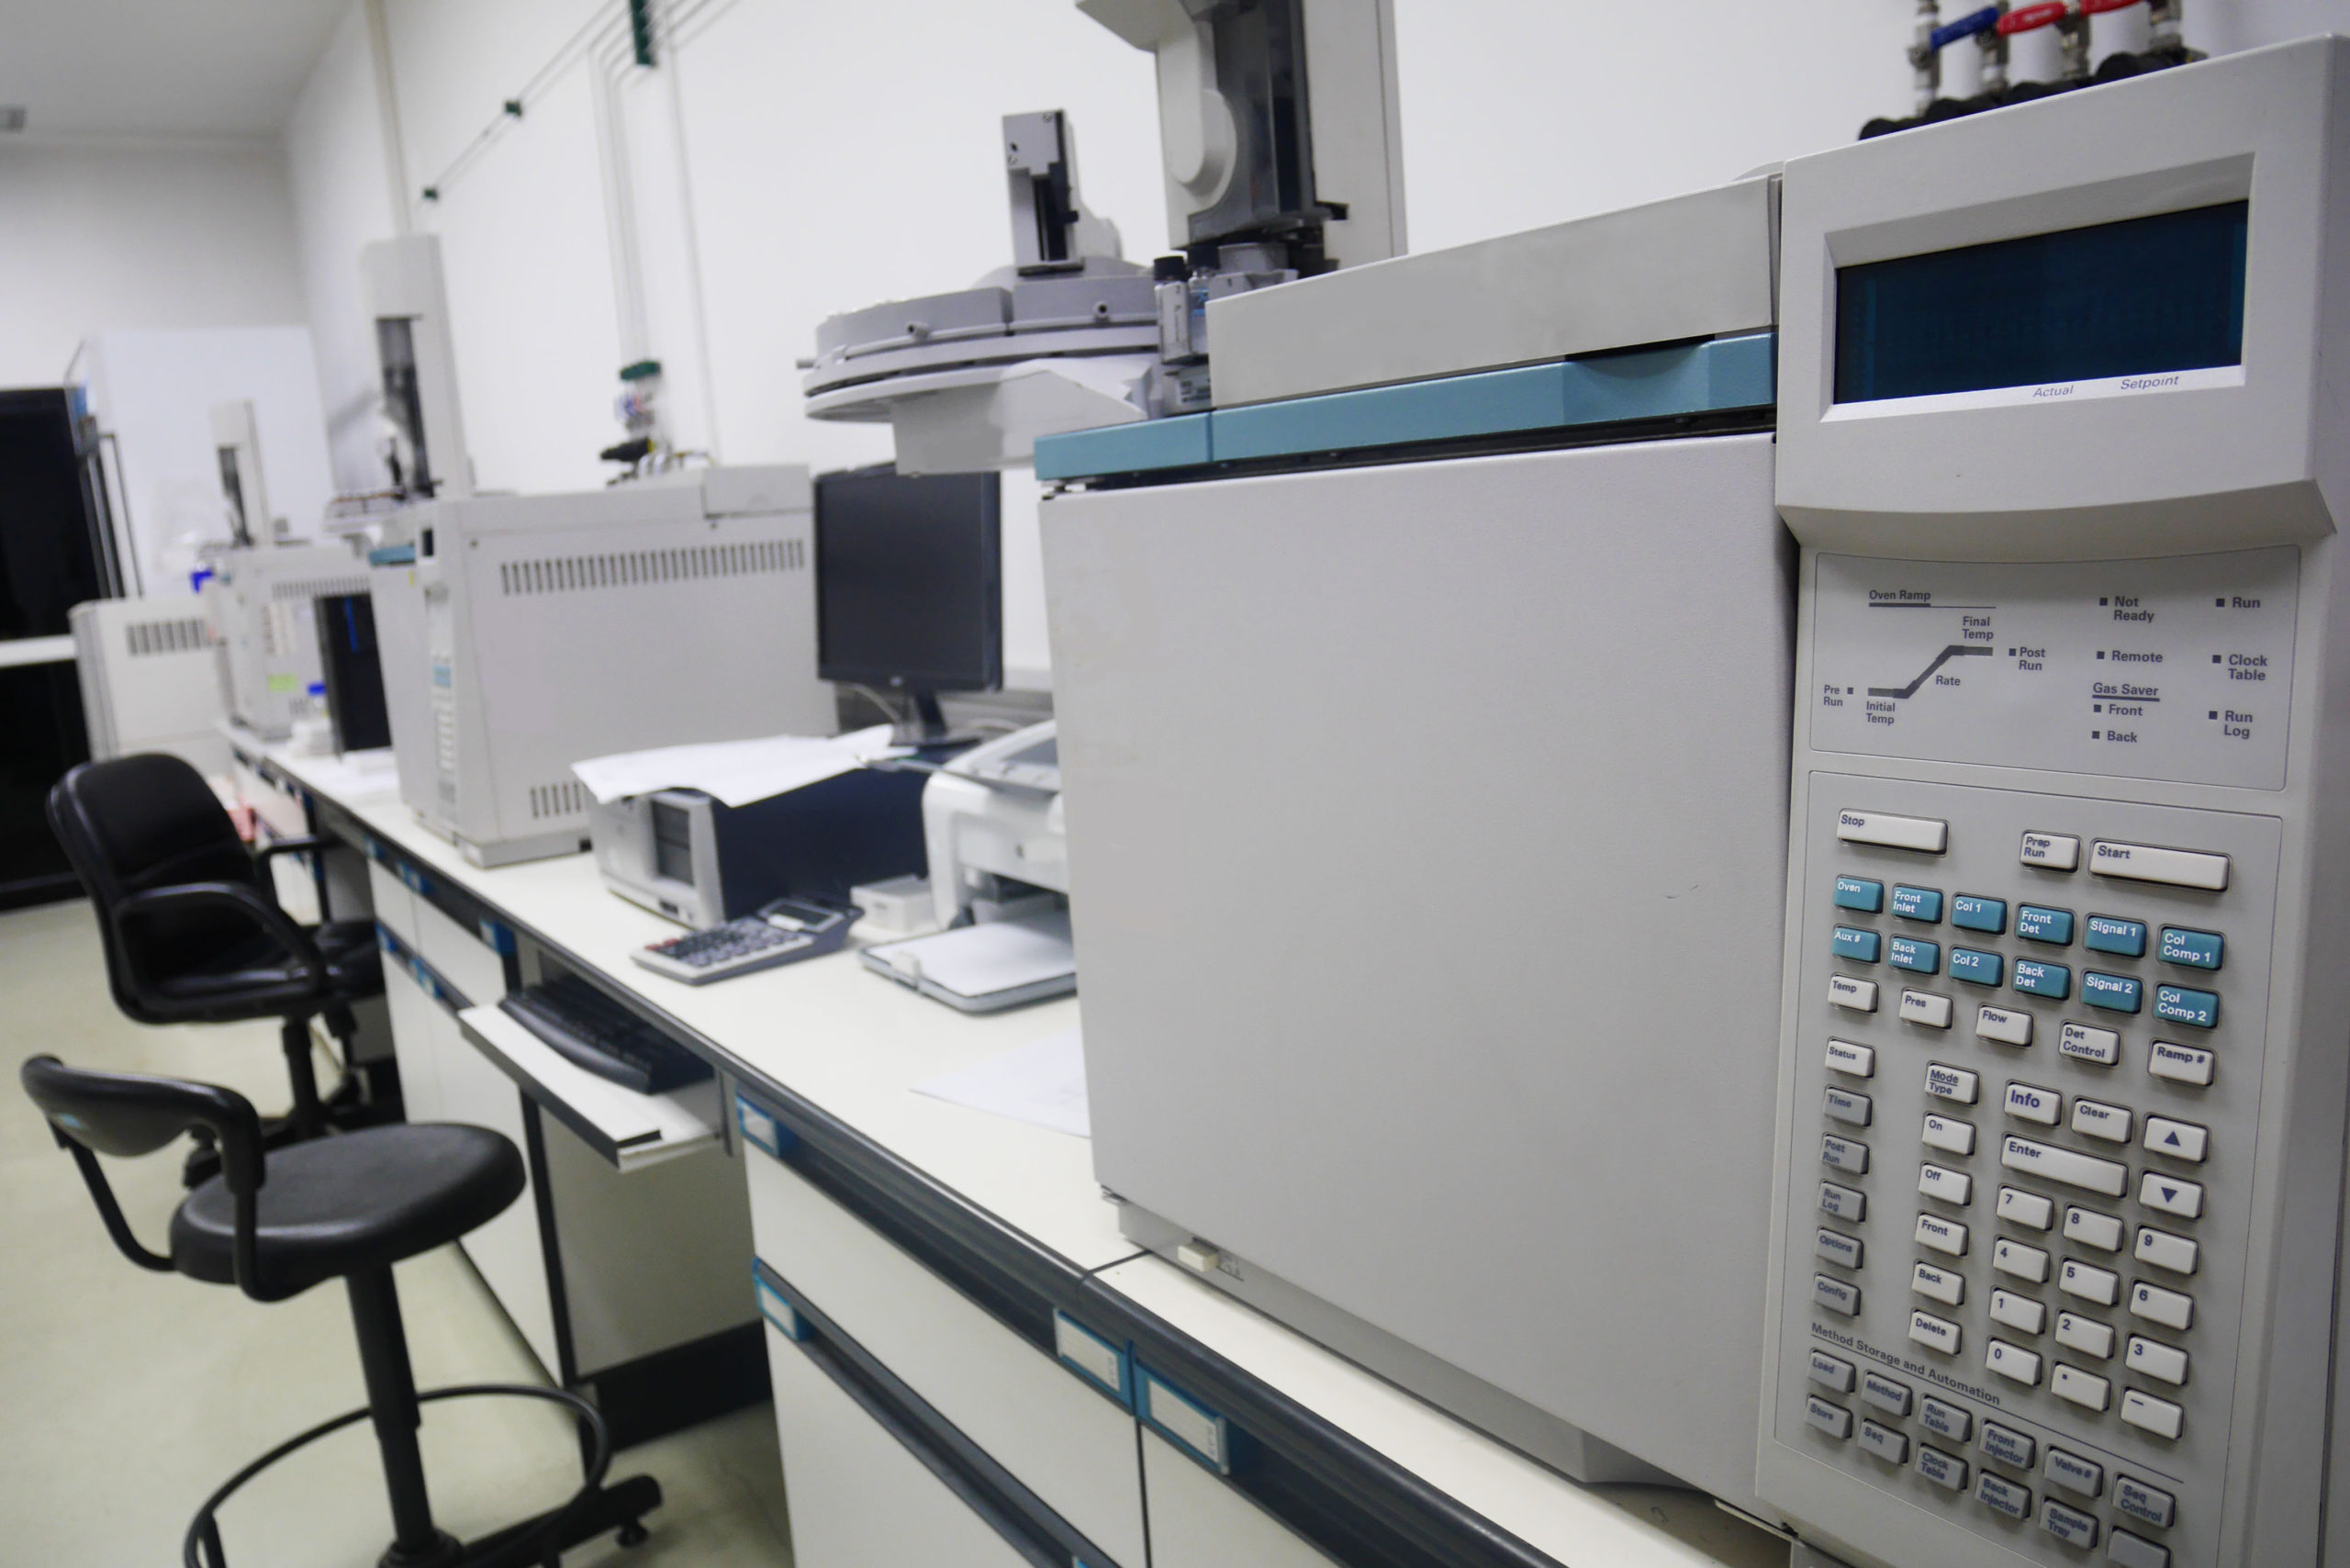
Gas chromatography, or GC, is a very good method of determining volatile percentages in a dip tank. Essentially, a GC heats and vaporizes the sample and carries it through a column (fundamentally, a long tube ). Depending on the material, the rate of movement through the column may vary.. As a result, the volatiles are separated into the various components and the elapsed time in the column is measured and plotted on a chromatogram. Special software is then used to determine what the material is and its concentration in the sample.
Chromatogram example:

Now that we know the exact solvents and their percentages in the tank, we can compare them to the “virgin” material and what the ratios should be. This GC information, as well as the viscosity and solids data, take the guesswork out of tank additions and promote long-term tank health and performance.
Using GC analysis is just another way we work with our customers to control the situation and predict problems before they happen. Another way we demonstrate our proactive, comprehensive, commitment to your ongoing success.