Problem: When we initially do a line survey of a prospective customer, we often find that they do not know the root source of their problems. This was the case for a Midwest manufacturer of industrial trailers. They knew they had a quality problem – they just could not nail down exactly what the source(s) were. That is when we proposed a PFMEA.
A Process Failure Mode Effect Analysis (PFMEA) is used to identify potential failures associated with the manufacturing process. Each step of the process – from delivery of raw materials to delivery to the end user – is analyzed to identify potential processes that could go wrong.
Process Review: Our Tech Service team spent three days on-site to follow the entire production process through the facility. Delivery of steel, cleaning, painting, curing, storage, and delivery to their end customer were all processes that were evaluated.
Possible Failure Modes: Our quality team (consisting of Sales, Lab, and Tech Service) reviewed the detailed process list to determine potential failure points for each step in each process.
Potential Failure Effects: Once the potential failures were identified we determined the expected impact they would have on the quality of the final product.
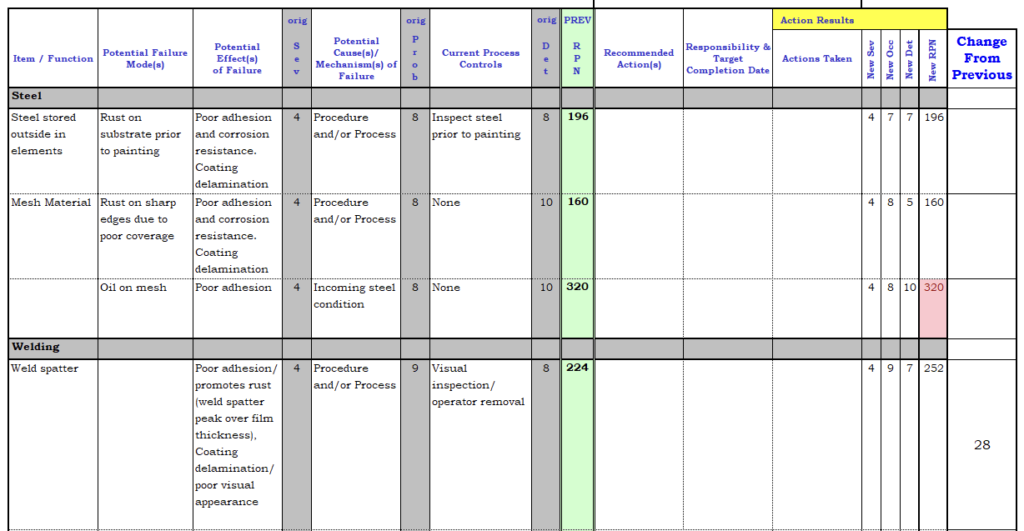
Probable Failure Cause: We then determined what could cause the potential failure.
Severity Ranking: We then assigned a severity ranking of 1-10 to the failure. 1 for the lowest risk, 10 for highest risk.
Occurrence Ranking: We then determined an occurrence ranking. 1 for least likely, 10 for highly likely that the failure would occur.
Detection Ranking: We then determined the likelihood that the failure would be detected. 1 for easily detected, 10 for very hard to detect.
Risk Priority Number (RPN) calculated: This is an overall risk analysis. This is found by multiplying the Severity Ranking X Occurrence Ranking X Detection Ranking. For example, if the Severity was 2 and th, there was 5 and the Detection was 5 then the RPN would be 50. Another example could be; if the Severity was 7, the Occurrence was 8 and the Detection was 9 the RPN would be 504. The higher the RPN, the higher the risk. Corrective actions ideally lead to a lower RPN number.
This whole process took over a month to develop and present to our prospective customer. After displacing the incumbent supplier, we worked with them for over 18 months to “attack” and improve the processes that were most detrimental to overall product quality.
RPNs were monitored each month to confirm that the improvements that were being made were effective. Near the end of the 18 months, their quality complaints concerning paint went from over four hundred complaints a month (on average) to just one.
Marcus Paint Company has and maintains a very proactive approach to all our client’s issues, needs, and requirements. We continually evaluate our client’s coating operations and processes through regularly scheduled Technical Account Manager visits and constantly strive to improve quality and enhance their paint operations, processes, and procedures.